
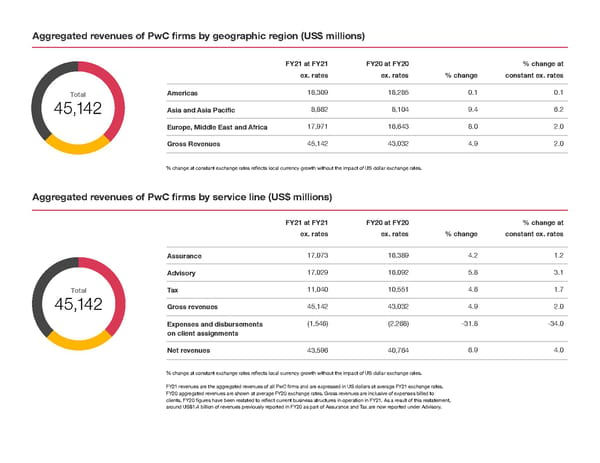
Aggregated revenues of PwC ifrms by geographic region (US$ millions) FY21 at FY21 FY20 at FY20 % change at ex. rates ex. rates % change constant ex. rates Total Americas 18,309 18,285 0.1 0.1 45,142 Asia and Asia Paciifc 8,862 8,104 9.4 6.2 Europe, Middle East and Africa 17,971 16,643 8.0 2.0 Gross Revenues 45,142 43,032 4.9 2.0 % change at constant exchange rates relfects local currency growth without the impact of US dollar exchange rates. Aggregated revenues of PwC ifrms by service line (US$ millions) FY21 at FY21 FY20 at FY20 % change at ex. rates ex. rates % change constant ex. rates Assurance 17,073 16,389 4.2 1.2 Advisory 17,029 16,092 5.8 3.1 Total Tax 11,040 10,551 4.6 1.7 45,142 Gross revenues 45,142 43,032 4.9 2.0 Expenses and disbursements (1,546) (2,268) -31.8 -34.0 on client assignments Net revenues 43,596 40,764 6.9 4.0 % change at constant exchange rates relfects local currency growth without the impact of US dollar exchange rates. FY21 revenues are the aggregated revenues of all PwC ifrms and are expressed in US dollars at average FY21 exchange rates. FY20 aggregated revenues are shown at average FY20 exchange rates. Gross revenues are inclusive of expenses billed to clients. FY20 ifgures have been restated to relfect current business structures in operation in FY21. As a result of this restatement, around US$1.4 billion of revenues previously reported in FY20 as part of Assurance and Tax are now reported under Advisory.
 Global Annual Review | PwC Page 9 Page 11